In an economic environment where uncertainty is often the only constant, investors are on a continuous quest for strategies that secure their capital while seeking competitive returns. The Constant Proportion Portfolio Insurance (CPPI) method offers a solution by dynamically allocating assets between risky and safe investments, based on market performance. This article evaluates the effectiveness of CPPI compared to a traditional investment approach, illustrated by real data.
Please note that this analysis is conducted for educational and informational purposes only. It is not intended as financial advice, and no investment recommendations are made. The information presented in this study is based on historical data and experimental analyses, and does not guarantee future performance of Bitcoin or any other financial asset. Readers are encouraged to consult qualified finance and investment professionals before making investment decisions. The author and contributors disclaim all liability for decisions made based on the information provided in this article.
Much of the content in this article is inspired by a comprehensive training program I attended (Investment Management with Python and Machine Learning Specialization by EDHEC Business School) which focused on the concepts discussed herein.
What is CPPI?
CPPI is an investment strategy that adjusts the ratio of exposure to risky and non-risky assets in a portfolio, based on current market performance and the level of capital to be protected. The key principle is to maintain a « cushion » of funds, which is the difference between the current value of the portfolio and the amount of capital protected. This cushion determines the investment in risky assets, with the goal of participating in bullish markets while protecting against significant downturns.
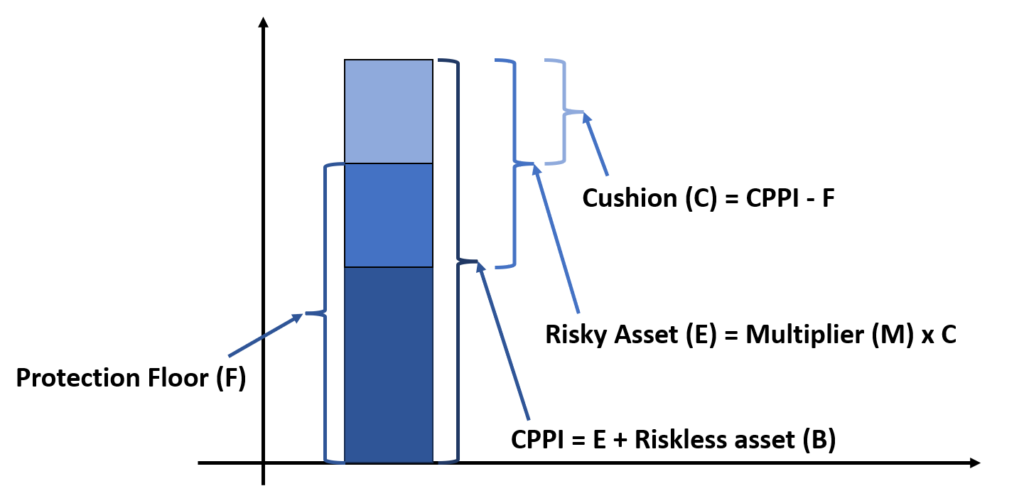
- Protection Floor: This is the minimum amount you want to guarantee for your investment, no matter what happens. Think of it as a safety net that prevents you from losing all your initial capital.
- CPPI: Stands for Constant Proportion Portfolio Insurance. It’s a strategy that automatically adjusts the allocation between risky and riskless assets in your portfolio to protect the protection floor while still allowing you to benefit from bullish markets.
- Riskless Asset (B): These are investments considered safe, such as government bonds or money placed in a savings account. The return is generally lower, but there’s also less risk of loss. For example, U.S. Treasury bonds are often viewed as riskless assets because they are backed by the full faith and credit of the U.S. government.
- Risky Asset (E): These assets, like stocks or commodities, carry a higher risk but also offer the potential for higher returns. The CPPI strategy adjusts how much of your portfolio is invested here, based on the level of risk you’re willing to take. A practical example of a risky asset could be shares in a technology company like Apple or Amazon, which can fluctuate significantly in value.
- Multiplier (M): This factor determines how aggressively your investment in risky assets is made. A higher multiplier means you’re willing to take more risks to achieve better returns, increasing the amount of money invested in risky assets when the market is favorable.
- Cushion (C): This is the difference between the current value of your portfolio (the CPPI) and the protection floor. It essentially represents the « extra » money you’ve earned beyond your minimum safety, which you can risk for additional gains.
In illustrating a CPPI strategy with a static floor, we utilize iShares Core S&P 500 UCITS ETF as our example of a risky asset, paired with a risk-free rate of 3%. The ETF provides access to the growth potential of the U.S. stock market, aiming for higher returns, while the fixed 3% risk-free rate reflects the steady income from safe investments like government bonds. This setup showcases how a CPPI strategy can manage risk and return by dynamically balancing between the high-growth potential of the S&P 500 ETF and the stability of a risk-free asset, all within the constraints of a static floor designed to protect the portfolio’s capital.
Quantitative Analysis of CPPI Strategy
In this section, we focus on monthly returns data spanning from the year 2000 to 2014 to evaluate our CPPI strategy’s performance. The foundational parameter of our strategy, the static floor, is set at 80%, signifying that the strategy aims to protect at least 80% of the portfolio’s initial value, regardless of market fluctuations. Additionally, we employ a multiplier (M) of 3, indicating a leveraged approach to investment in the risky asset, in this case, the iShares Core S&P 500 UCITS ETF.
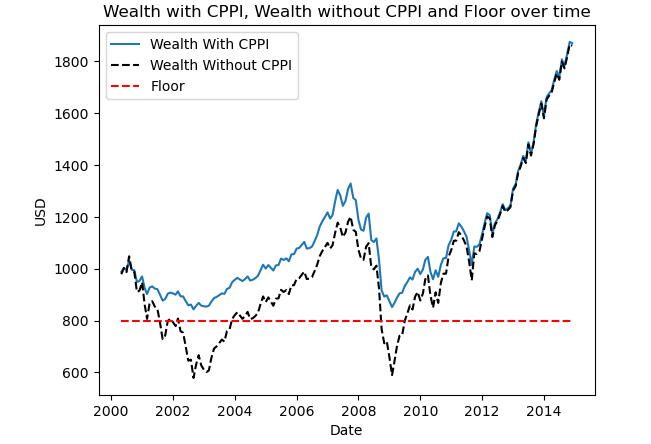
The CPPI strategy has demonstrated its effectiveness in our analysis, effectively preventing the investment value from falling below $800 on two separate occasions. This was achieved by automatically rebalancing towards the riskless asset when the market turned downward, showcasing the strategy’s inherent mechanism for capital protection. The CPPI strategy is designed to shield the investor’s capital by reducing exposure to risky assets during market downturns, which is a critical advantage for those seeking to minimize losses. However, it’s important to note that while CPPI excels at protecting the capital, it also tends to recover more slowly from market dips compared to a portfolio without CPPI. We can now proceed to compare some key statistics between the two investments to evaluate the performance and risk profiles of each strategy, one employing the CPPI method and the other without.

- Annualized Return: The strategy without CPPI has a slightly higher annualized return compared to the one with CPPI.
- Annualized Volatility: The CPPI strategy shows a lower annualized volatility, indicating a potentially smoother investment ride over time.
- Skewness: Both strategies show negative skewness, but the CPPI strategy is more negatively skewed, suggesting a higher frequency of negative returns.
- Kurtosis: The CPPI strategy has a higher kurtosis, which may indicate a higher risk of extreme returns.
- Cornish-Fisher VaR (5%): The CPPI strategy has a lower value-at-risk, which points to lower potential losses under normal market conditions.
- Historic CVaR (5%): Again, CPPI shows a lower conditional value-at-risk, indicating lower expected losses on the worst days.
- Sharpe Ratio: The CPPI strategy has a significantly higher Sharpe ratio, implying a better risk-adjusted return.
- Max Drawdown: The maximum drawdown is lower for the CPPI strategy, aligning with the strategy’s goal to protect against significant losses.
In summary, while the no-CPPI strategy might offer a slightly higher return, the CPPI strategy exhibits lower risk by various measures, including volatility, value-at-risk, and maximum drawdown, and provides a higher Sharpe ratio, indicating more efficient performance on a risk-adjusted basis. This suggests that the CPPI strategy may be more suitable for risk-averse investors who prioritize capital preservation and a steadier return profile.
Quantitative Analysis of CPPI Strategy with Dynamic Floor
It appears there might be an issue because as the price of the asset rises, it becomes increasingly unlikely that it will revert to the initial floor of $800. In such a scenario, the effectiveness of the CPPI strategy may be compromised because the original rationale behind the floor—to protect the portfolio from significant loss—becomes less relevant if the asset value has grown substantially. In other words, the static nature of the original floor does not capitalize on the portfolio’s growth.
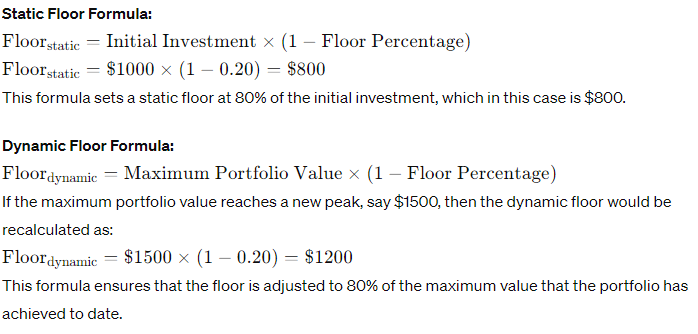
To address this, implementing a dynamic floor could be a strategic improvement. This approach adjusts the floor to be 80% of the portfolio’s peak value, rather than a fixed dollar amount. As the asset value increases, the floor rises accordingly, continuously locking in a proportion of the gains and ensuring that the portfolio is protected against a percentage of the highest value it has achieved, not just the initial investment. This dynamic adjustment maintains the protective feature of the CPPI strategy while also allowing the investment to benefit more fully from favorable market movements.
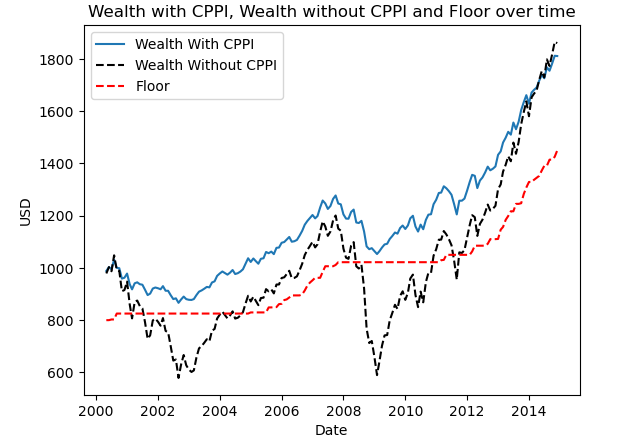
Here are the results of implementing a dynamic floor strategy:
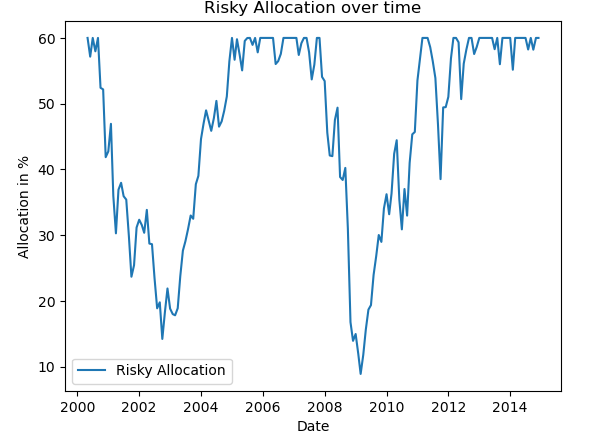
Using this dynamic floor, the risky asset allocation over time looks like this :
And the maximum drawdowns of the two investments :
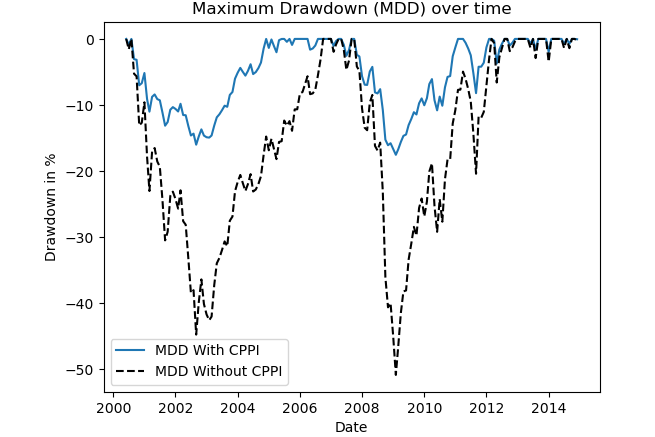
Now, with the application of a dynamic floor, we observe that the floor consistently remains at 80% of the asset’s peak value, never falling below this threshold. This mechanism is known as a « maximum drawdown process » ensuring that the protection level rises with the asset value and doesn’t decrease. We can see that, in the absence of CPPI, the value of the risky asset crosses the floor threshold more frequently than before. This new setup allows us to analyze the statistics and compare them as we did previously, giving us a clearer understanding of the benefits and limitations of a dynamic versus a static floor in investment strategies.

- Annualized Return: The no-CPPI strategy yields a slightly higher annualized return compared to the CPPI strategy.
- Annualized Volatility: The CPPI strategy exhibits significantly lower volatility, indicating more stable performance over time.
- Skewness: Both strategies have negative skewness, but the CPPI strategy is less negatively skewed, indicating fewer extreme negative returns.
- Kurtosis: The CPPI strategy has a lower kurtosis, suggesting less exposure to extreme events compared to the no-CPPI strategy.
- Cornish-Fisher VaR (5%): The CPPI strategy’s value-at-risk is markedly lower, suggesting reduced risk of large losses in normal market conditions.
- Historic CVaR (5%): The conditional value-at-risk is lower for CPPI, indicating smaller expected losses on the worst-performing days.
- Sharpe Ratio: The CPPI strategy has a notably higher Sharpe ratio, signifying better risk-adjusted returns.
- Max Drawdown: The maximum drawdown for the CPPI strategy is significantly less, reaffirming its ability to protect against large losses.
Evaluation and Comparison of Investment Strategy Performances
In evaluating the performance of investment strategies, it’s important to use various statistical measures to get a full picture of their effectiveness. We employed a t-test to compare the mean returns, Levene’s test to assess the equality of variances, and reviewed the Sharpe Ratios to understand risk-adjusted returns. We also compared the maximum drawdowns to measure the strategies’ downside risks.
The t-test resulted in a t-statistic of 0.291 and a p-value of 0.771, indicating no statistically significant difference in mean returns between the No-CPPI and CPPI strategies. This suggests that the returns of the two strategies are similar on average.
Levene’s test provided a statistic of 64.005 and a p-value close to zero, which is highly significant. This result indicates a significant difference in the volatility of the two strategies, with the CPPI strategy likely being less volatile due to the risk management it employs.
In terms of maximum drawdown, which measures the largest peak-to-trough decline in the value of the investment, the No-CPPI strategy experienced a larger maximum drawdown of -0.50894 compared to the CPPI’s -0.175529. This finding aligns with the intention behind CPPI, which is to minimize significant losses.
Conclusion
In conclusion, the statistical tests reinforce the CPPI strategy’s objective of reducing volatility and lessening drawdowns, albeit with a trade-off in terms of risk-adjusted performance as indicated by the Sharpe Ratio. The choice between these strategies may come down to the investor’s risk tolerance and whether they prioritize stability and downside protection over the potential for higher returns.

Laisser un commentaire